
I need a powerpoints decorated slides with precise information about the poem " the road not taken"
Presentation examples
Presentation Ideas from Real Visitor Prompts
Browse eligible slide decks shared by FreeSlide visitors, study the original prompts, and adapt an idea into your own deck.
Browse 4671 real creationsMade by visitors
All decks
Showing 121–144 of 4671. No stock examples or system defaults. Choose a tool, study a real result, then reopen its prompt as your starting point.

a 10 pGE PPT ON topic reinforcement learing in ai

Debate class for grade 3. make it look cute for school. the debate question is "is it ever okay to break the rules?" and we will look at these examples from Matilda. 7 slides. make a separate slide for each example with "action" and "reason" for each 1. The Platinum Blonde Hair Dye Matilda secretly mixes peroxide into her father’s hair oil, turning his hair green . Mr. Wormwood routinely calls Matilda a liar and an idiot; he tears up her library book in front of her . 2. The Superglue Hat Matilda lines the inside of her father’s hat with superglue, forcing him to keep it on for days . Mr. Wormwood destroys her book and dismisses her intelligence; this is a targeted, non-violent consequence . 3. The Parrot in the Chimney Matilda hides her friend’s talking parrot in the chimney so the family believes their house is haunted . Her parents ignore her, insult her, and refuse to acknowledge her; the prank exploits their superstition without harming anyone. 4. The Newt / Water Jug Incident During Miss Trunchbull’s tirade, Matilda uses her telekinetic power to tip the water jug, causing a newt to climb on the headmistress . Matilda is falsely accused of putting the newt in the jug; she acts to defend herself and expose Trunchbull’s cruelty . 5. The Chalkboard “Ghost” Matilda uses her powers to make chalk write a message from Miss Honey’s deceased father, terrifying Miss Trunchbull into fleeing . Miss Trunchbull has abused children for years, stolen Miss Honey’s inheritance, and may have murdered her own brother-in-law . 6. Choosing to Stay with Miss Honey Matilda refuses to leave with her parents when they flee to Spain, asking instead to live with Miss Honey . Her parents are neglectful, dishonest criminals who never wanted her; Matilda chooses a safe, loving home.

Debate class for grade 3. make it look cute for school. the debate question is "is it ever okay to break the rules?" and we will look at these examples from Matilda. 7 slides 1. The Platinum Blonde Hair Dye Matilda secretly mixes peroxide into her father’s hair oil, turning his hair green . Mr. Wormwood routinely calls Matilda a liar and an idiot; he tears up her library book in front of her . 2. The Superglue Hat Matilda lines the inside of her father’s hat with superglue, forcing him to keep it on for days . Mr. Wormwood destroys her book and dismisses her intelligence; this is a targeted, non-violent consequence . 3. The Parrot in the Chimney Matilda hides her friend’s talking parrot in the chimney so the family believes their house is haunted . Her parents ignore her, insult her, and refuse to acknowledge her; the prank exploits their superstition without harming anyone. 4. The Newt / Water Jug Incident During Miss Trunchbull’s tirade, Matilda uses her telekinetic power to tip the water jug, causing a newt to climb on the headmistress . Matilda is falsely accused of putting the newt in the jug; she acts to defend herself and expose Trunchbull’s cruelty . 5. The Chalkboard “Ghost” Matilda uses her powers to make chalk write a message from Miss Honey’s deceased father, terrifying Miss Trunchbull into fleeing . Miss Trunchbull has abused children for years, stolen Miss Honey’s inheritance, and may have murdered her own brother-in-law . 6. Choosing to Stay with Miss Honey Matilda refuses to leave with her parents when they flee to Spain, asking instead to live with Miss Honey . Her parents are neglectful, dishonest criminals who never wanted her; Matilda chooses a safe, loving home.

Create an 8-slide PowerPoint presentation in Tajik about banks: their origins, main services, economic benefits, and types. Include the National Bank of Tajikistan and commercial banks. Use a modern blue-and-white design, relevant banking photos, clear short bullet points, correct Tajik Cyrillic text, and a final conclusion. Suitable for Grade 11 students and a 5–7 minute presentation. Export as editable PPTX.

Create a professional and visually attractive PowerPoint presentation on the topic **“Data Visualization Using Python”** for a college-level Data Science subject. The presentation should contain 10 slides and be suitable for a student to present in class. ### Slide Structure: **Slide 1: Title Slide** - Title: Data Visualization Using Python - Subtitle: Exploring Data Through Graphs and Charts - Include student name, class, subject, and college name placeholders. - Add a Python-themed visual background. **Slide 2: Introduction to Data Visualization** - Define data visualization. - Explain why data visualization is important in data science. - Give real-world examples such as weather forecasting, business analytics, and healthcare. **Slide 3: Importance of Data Visualization** - Simplifies complex data. - Helps identify trends and patterns. - Makes comparison easier. - Supports decision-making. - Communicates data insights effectively. **Slide 4: Python Libraries for Data Visualization** Explain the following libraries: - Matplotlib - Seaborn - Pandas Mention the main purpose and features of each library. **Slide 5: Types of Data Visualization** Explain different types of charts: - Bar chart - Line chart - Pie chart - Histogram - Scatter plot Include an example image of each chart. **Slide 6: Introduction to Matplotlib** - Explain what Matplotlib is. - Show a simple Python code example to create a line chart. - Explain the basic functions: plot(), title(), xlabel(), ylabel(), show(). **Slide 7: Introduction to Seaborn** - Explain what Seaborn is. - Show an example of creating a bar plot or heatmap. - Explain how Seaborn makes visualizations more attractive. **Slide 8: Real-World Application** Explain how data visualization is used in: - Business and sales analysis - Healthcare - Education - Weather forecasting - Social media analytics Include relevant examples and visual illustrations. **Slide 9: Advantages and Limitations** Advantages: - Easy understand

Oʻzbekiston Respublikasi Vazirlar Mahkamasining qarori Zoʻravonlikdan jabrlangan, oʻziga nisbatan zoʻravonlik sodir etilishi xavfi ostida va ijtimoiy jihatdan xavfli ahvolda boʻlgan bolalar hamda ularning oilalariga ijtimoiy xizmatlarni tashkil qilish chora-tadbirlari toʻgʻrisida

Create exactly 2 slides about Types of Internet Connections. Slide 1: DSL, cable, fiber optic, Wi-Fi, mobile internet and satellite internet. Slide 2: advantages, uses and conclusion. Use simple English, attractive visuals, and a professional blue theme. Export as an editable PowerPoint (.pptx).

Create a 10-slide presentation in simple English about the Present Continuous tense. Explain its structure, affirmative sentences, negative sentences, questions, uses, spelling rules for adding -ing, time expressions, and examples. Include a short practice activity with answers. Use clear explanations, attractive designs, and colorful visuals suitable for school students.

Жұқпалы аурулардың алдын алуда медициналық мейіргердің рөлі: заманауи тәсілдер. Жұқпалы аурулардың алдын алуға қатысты қазіргі халықаралық және ұлттық ұсынымдар (ДДСҰ, ҚР ДСМ) тақырыбында маған 25 беттік слайд жасап берші

Continue the same QA/QC Management Review 2026 presentation. Create the final 2 editable slides using navy blue, white and grey. Maintain the same fonts, layout, industrial design and chart style. Use simple English, attractive visuals and short speaker notes. SLIDE 6: ANALYSIS AND IMPROVEMENT PLAN Create an editable table with columns: Issue, Proposed Action, Responsible Department, Due Date, Effectiveness Check. Priorities: Investigate Blasting/Painting and Machining PNRs: 15 each. Investigate P Part & Support Item PNRs: 23. Investigate measurement claims: 4 out of 10. Review Flipper Arm claims: 5 out of 10. Review CAPA effectiveness and repeat issues. Propose reviewing inspection records, process controls and verified evidence. Responsible department: [Confirm]. Due date: [Insert]. Effectiveness check: [Define]. Mark all unverified root causes as Pending Verification. SLIDE 7: CONCLUSION AND MANAGEMENT SUPPORT Summarise: PNR: 59 in 2025; 66 in 2026. CAPA: 14 in 2025; 9 in 2026. Customer claims: 9 in 2025; 10 in 2026. Average customer response time: 3.2 days across 10 cases. PNR disposition: Rework 27 to 37; Scrap 29 to 28; Use as-is 3 to 1. Recommend reviewing equivalent reporting periods, approved KPI targets, production/delivery quantities, open and overdue CAPAs, customer response deadlines and improvement actions. Include placeholders for management decisions, responsible persons, due dates and additional support required. Use KPI cards and a clean visual summary. State that lower counts alone do not prove quality improvement. All figures are supplied records, not approved targets. Mark year-to-year comparisons preliminary until equivalent reporting periods are confirmed. Ensure charts, tables, text and shapes are editable. Keep the entire presentation suitable for a 5–7 minute management meeting.

Continue the same QA/QC Management Review 2026 presentation. Create 2 editable slides using the existing navy blue, white and grey theme. Use attractive editable charts, exact data labels, simple English and short speaker notes. Do not invent root causes or CAPA status. SLIDE 4: 2026 CAPA AND CUSTOMER CLAIMS CAPA by process: Cutting 1; Bending 0; Rolling 0; Milling/Drilling 0; Beveling 0; Polishing/Grinding 1; Fitting 3; Welding 0; Blasting/Painting 2; Machining 2. Total 9. CAPA by part family: Machining Part 0; Flipper Arm 4; Fix Guide & Guide Retract 0; Spring Steel 0; Pedestal Bearing 2; Large Scope 0; Tower 0; Tension Rod 1; Tie Beam 0 recorded; Grating Floor 0; P Part & Support Item 2. Total 9. Customer claims by defect: Measurement 4; Other Reason 2; Finishing 2; Machining 2; Welding 0; Corrosion 0; Polishing/Grinding 0; Fabrication 0. Total 10. Customer claims by part: Flipper Arm 5; Pedestal Bearing 3; P Part 2; all other listed families 0. Total 10. Use clear editable bar charts. Highlight Measurement claims (4) and Flipper Arm claims (5). Do not invent root causes or claim CAPAs are closed. SLIDE 5: CUSTOMER RESPONSE TIME 2026 customer claim response records: 10 cases. Recorded days: 3, 6, 3, 5, 4, 1, 2, 1, 6, 1. Average: 3.2 days. Minimum: 1 day. Maximum: 6 days. Use KPI cards and an editable bar chart showing all 10 cases with exact labels. Add placeholder: [Confirm applicable customer response deadline and day-counting method]. Do not claim on-time compliance without confirmation.
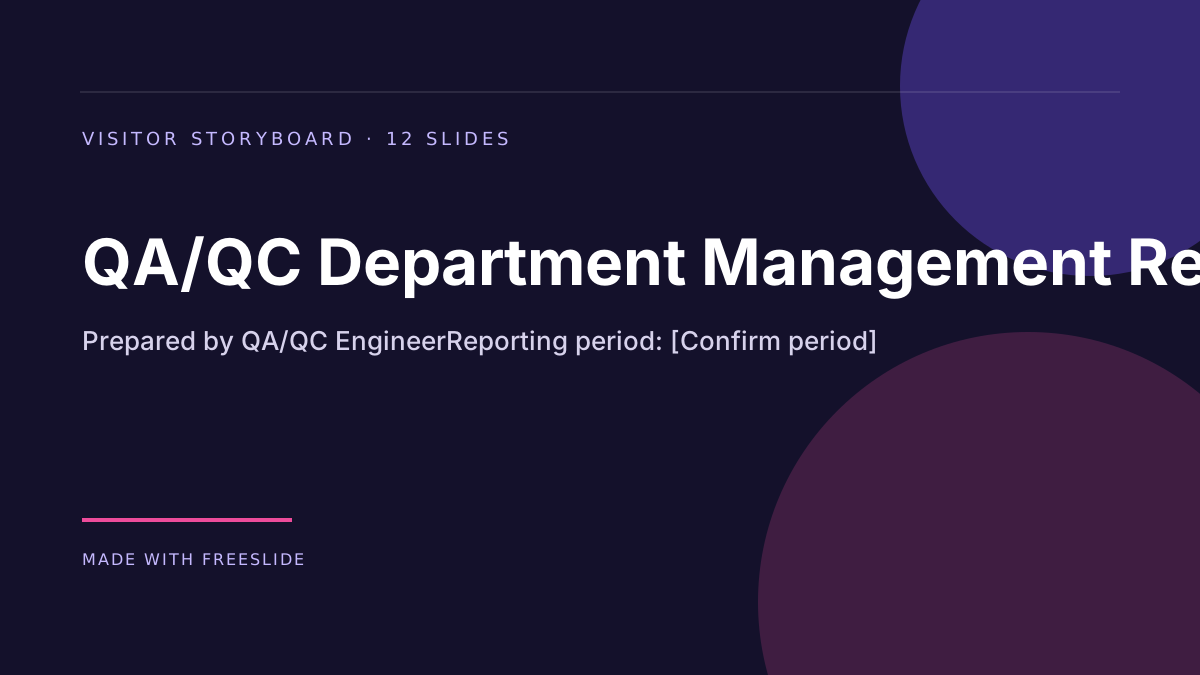
Create 3 professional, editable PowerPoint slides for a QA/QC Management Review 2026 for a supplier fabricating Bromma spreader arm spare parts. Use navy blue, white and grey, clean industrial design, simple English, attractive editable charts, clear data labels, KPI cards and short speaker notes. Do not invent data, targets or root causes. SLIDE 1: TITLE QA/QC Department Management Review, 2026. Prepared by QA/QC Engineer. Reporting period: [Confirm period]. SLIDE 2: KPI DASHBOARD PNR by source: 2025 Internal 31, Supplier 20, Customer 8, Total 59. 2026 Internal 45, Supplier 14, Customer 7, Total 66. CAPA by source: 2025 Internal 3, Supplier 3, Customer 8, Total 14. 2026 Internal 2, Supplier 0, Customer 7, Total 9. Customer claims: 2025 = 9; 2026 = 10. PNR disposition: 2025: Rework 27, Scrap 29, Use as-is 3, Total 59. 2026: Rework 37, Scrap 28, Use as-is 1, Total 66. Use editable grouped or stacked charts. Show exact counts and year-to-year changes: PNR +11.9%, CAPA -35.7%, claims +11.1%, Rework +37.0%, Scrap -3.4%, Use as-is -66.7%. Highlight increasing rework. Do not claim quality improved because scrap decreased. Mark comparisons preliminary until equivalent reporting periods are confirmed. SLIDE 3: 2026 PNR ANALYSIS PNR by process: Cutting 11; Bending 5; Rolling 0; Milling/Drilling 1; Beveling 3; Polishing/Grinding 3; Fitting 10; Welding 3; Blasting/Painting 15; Machining 15. Total 66. PNR by part family: Machining Part 14; Flipper Arm 10; Fix Guide & Guide Retract 3; Spring Steel 2; Pedestal Bearing 3; Large Scope 2; Tower 5; Tension Rod 1; Tie Beam 0 recorded; Grating Floor 3; P Part & Support Item 23. Total 66. Use two readable editable horizontal bar charts. Highlight Blasting/Painting and Machining (15 each) and P Part & Support Item (23). Explain that counts are not defect rates without production quantities.

12頁ppt講維摩詰經,要有豐富既插圖柔及背景圖

12頁ppt講維摩詰經

Create 3 additional slides for the same QA/QC Management Review presentation for a Bromma spreader arm spare parts fabrication supplier. Match the navy blue, white and grey design. Use simple English and short speaker notes. SLIDE 5: CUSTOMER RESPONSE TIME 2026 customer claim response records: 10 cases. Recorded days to reply: 3, 6, 3, 5, 4, 1, 2, 1, 6, 1. Average: 3.2 recorded days. Minimum: 1 day. Maximum: 6 days. State that the applicable customer response deadline and day-counting method must be confirmed. Do not claim on-time compliance without the required deadline. SLIDE 6: ANALYSIS AND IMPROVEMENT PLAN Priorities: Investigate PNRs in Blasting/Painting and Machining: 15 each. Investigate PNRs in P Part & Support Item: 23. Investigate customer measurement claims: 4 out of 10. Review Flipper Arm customer claims: 5 out of 10. Review CAPA effectiveness and any repeat issues. Include columns for issue, proposed action, responsible department, due date, and effectiveness check. Mark root causes as pending verification unless confirmed in the records. SLIDE 7: CONCLUSION AND MANAGEMENT SUPPORT Summarize: PNR: 59 in 2025 and 66 in 2026. CAPA: 14 in 2025 and 9 in 2026. Customer claims: 9 in 2025 and 10 in 2026. Average recorded customer response time: 3.2 days across 10 cases. Recommend reviewing equivalent reporting periods, approved KPI targets, production/delivery quantities, open and overdue CAPAs, and customer response deadlines. Ask management for support where needed. IMPORTANT: These figures are supplied records, not approved targets. Do not invent missing information or claim quality has improved solely because counts decreased. Use placeholders where needed. Make all slides editable and suitable for a 5–7 minute presentation.

Create 4 professional PowerPoint slides for a QA/QC Management Review for a supplier fabricating Bromma spreader arm spare parts. Use navy blue, white and grey, clean industrial design, readable charts and simple English. Do not invent any data. SLIDE 1: Title — QA/QC Department Management Review, 2026, prepared by QA/QC Engineer. Include reporting period [confirm period]. SLIDE 2: KPI DASHBOARD PNR by source: 2025: Internal 31, Supplier 20, Customer 8. Total 59. 2026: Internal 45, Supplier 14, Customer 7. Total 66. CAPA by source: 2025: Internal 3, Supplier 3, Customer 8. Total 14. 2026: Internal 2, Supplier 0, Customer 7. Total 9. Customer complaints: 2025: 9 claims. 2026: 10 claims. Show year-to-year counts and percentage changes. Label the comparison preliminary until equivalent reporting periods are confirmed. SLIDE 3: 2026 PNR ANALYSIS PNR by process: Cutting 11; Bending 5; Rolling 0; Milling/Drilling 1; Beveling 3; Polishing/Grinding 3; Fitting 10; Welding 3; Blasting/Painting 15; Machining 15. Total 66. PNR by part family: Machining Part 14; Flipper Arm 10; Fix Guide & Guide Retract 3; Spring Steel 2; Pedestal Bearing 3; Large Scope 2; Tower 5; Tension Rod 1; Tie Beam 0 recorded; Grating Floor 3; P Part & Support Item 23. Total 66. Highlight Blasting/Painting and Machining as the largest process categories. Highlight P Part & Support Item as the largest part family. Include a bar chart. SLIDE 4: 2026 CAPA AND CUSTOMER CLAIMS CAPA by process: Cutting 1; Bending 0; Rolling 0; Milling/Drilling 0; Beveling 0; Polishing/Grinding 1; Fitting 3; Welding 0; Blasting/Painting 2; Machining 2. Total 9. CAPA by part family: Machining Part 0; Flipper Arm 4; Fix Guide & Guide Retract 0; Spring Steel 0; Pedestal Bearing 2; Large Scope 0; Tower 0; Tension Rod 1; Tie Beam 0 recorded; Grating Floor 0; P Part & Support Item 2. Total 9. Customer claims by defect: Measurement 4; Other Reason 2; Finishing 2; Machining 2; Welding 0; Corrosion 0; Polishing/Grinding 0;

- 직렬공진 Gate 신호 와 IGBT 와의 관계 설명 및 직렬공진 1차측 회로도 설명 - Eboost est O.V 발생 관련 복기회의

Core Principles of Biological Systems Emergent Properties One of the most profound features of living systems is that the whole is greater than the sum of its parts. Example: A single brain neuron cannot think, remember, or feel emotion. However, when billions of neurons connect in a complex neural network, consciousness emerges. These novel traits appear only when lower-level components interact within the system. Homeostasis and Feedback Loops To survive fluctuations in the external environment, living systems constantly self-regulate through feedback mechanisms: Negative Feedback: Reverses a change to return conditions to a set point (e.g., sweating when body temperature rises, or insulin lowering blood glucose after a meal). Positive Feedback: Amplifies a process until a specific endpoint is reached (e.g., blood clotting or uterine contractions during childbirth). Division of Labor and Specialization In multicellular organisms, cells undergo differentiation. Instead of every cell performing every task, cells specialize (e.g., red blood cells carry oxygen, white blood cells fight pathogens, root cells absorb water in plants). This specialization maximizes efficiency across the entire system. 3. Energy Flow and Information Processing For any system to maintain order and resist entropy (decay), it requires constant inputs of energy and information: Metabolism: Chemical pathways like cellular respiration break down nutrients to yield ATP (adenosine triphosphate), powering cellular machinery. Information Networks: DNA and RNA serve as the master blueprint, while cell-signaling pathways (hormones, neurotransmitters) act as communication networks, ensuring that distant parts of the organism coordinate their responses instantly. "add pictures"

Core Principles of Biological Systems Emergent Properties One of the most profound features of living systems is that the whole is greater than the sum of its parts. Example: A single brain neuron cannot think, remember, or feel emotion. However, when billions of neurons connect in a complex neural network, consciousness emerges. These novel traits appear only when lower-level components interact within the system. Homeostasis and Feedback Loops To survive fluctuations in the external environment, living systems constantly self-regulate through feedback mechanisms: Negative Feedback: Reverses a change to return conditions to a set point (e.g., sweating when body temperature rises, or insulin lowering blood glucose after a meal). Positive Feedback: Amplifies a process until a specific endpoint is reached (e.g., blood clotting or uterine contractions during childbirth). Division of Labor and Specialization In multicellular organisms, cells undergo differentiation. Instead of every cell performing every task, cells specialize (e.g., red blood cells carry oxygen, white blood cells fight pathogens, root cells absorb water in plants). This specialization maximizes efficiency across the entire system. 3. Energy Flow and Information Processing For any system to maintain order and resist entropy (decay), it requires constant inputs of energy and information: Metabolism: Chemical pathways like cellular respiration break down nutrients to yield ATP (adenosine triphosphate), powering cellular machinery. Information Networks: DNA and RNA serve as the master blueprint, while cell-signaling pathways (hormones, neurotransmitters) act as communication networks, ensuring that distant parts of the organism coordinate their responses instantly.

presentation about place value for 1st grade no numbers above 500

A 60 slide presentation about place value for 1st grade no numbers above 500

A 100 But slide presentation about place value for 1st grade no numbers above 500

A 1 Billion slide presentation about place value for 1st grade no numbers above 500